Here is a brief snapshot of the condo resales market since the start of 2016, shown as average price per SF broken down by sub-area/neighbourhood.
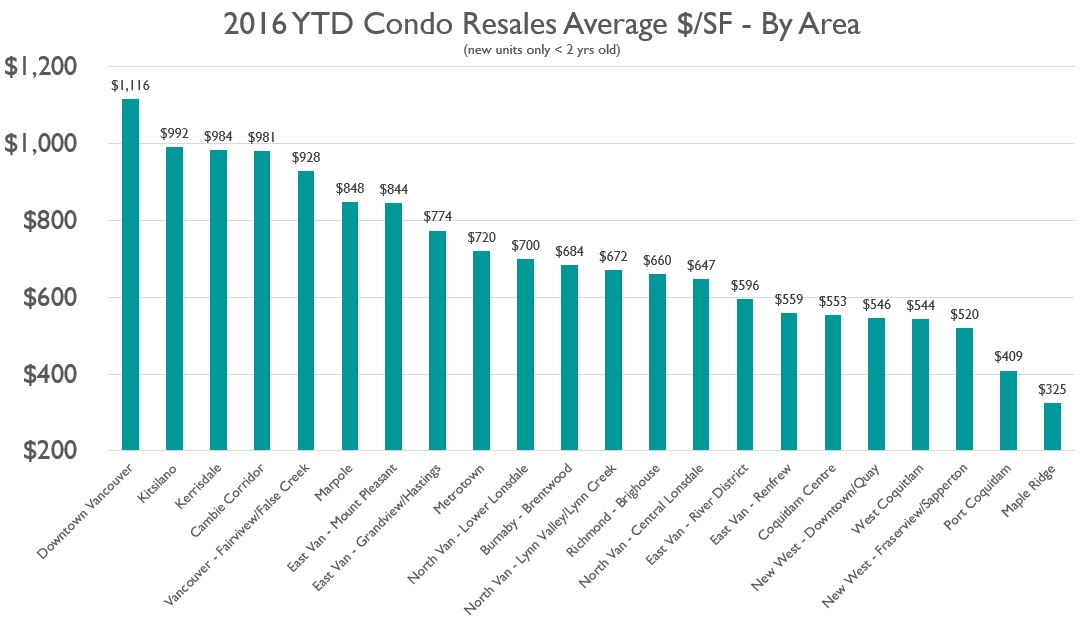
Source: MLS Data
The above chart reflects data on all MLS sales for condo units that were one year old or newer at the time of sale, and only includes neighbourhoods with sales in multiple buildings. Pricing is slightly distorted by product type; for example, all of the downtown condo product is concrete highrise which is more expensive, whereas all of Maple Ridge product is in lowrise or townhouse form that is much cheaper to build and sell. Nevertheless, some may find the average pricing stats interesting.
The market for pre-sales inventory is likely to track above the average resales in a given sub-market.
 Source: MLS Data